
Tag: data analytics

Announcing the Strategic Partnership Between Supermetrics & Calligo

Partnership announcement

We’re excited to announce a strategic partnership between Supermetrics, a global leader in marketing data aggregation, and Calligo. This collaboration combines Supermetrics’ robust data aggregation capabilities with Calligo’s expertise in designing advanced analytics ecosystems. Together, we’re poised to deliver end-to-end solutions that simplify data-driven decision-making, drive efficiency, and empower businesses to achieve smarter marketing outcomes.

Who is Supermetrics?

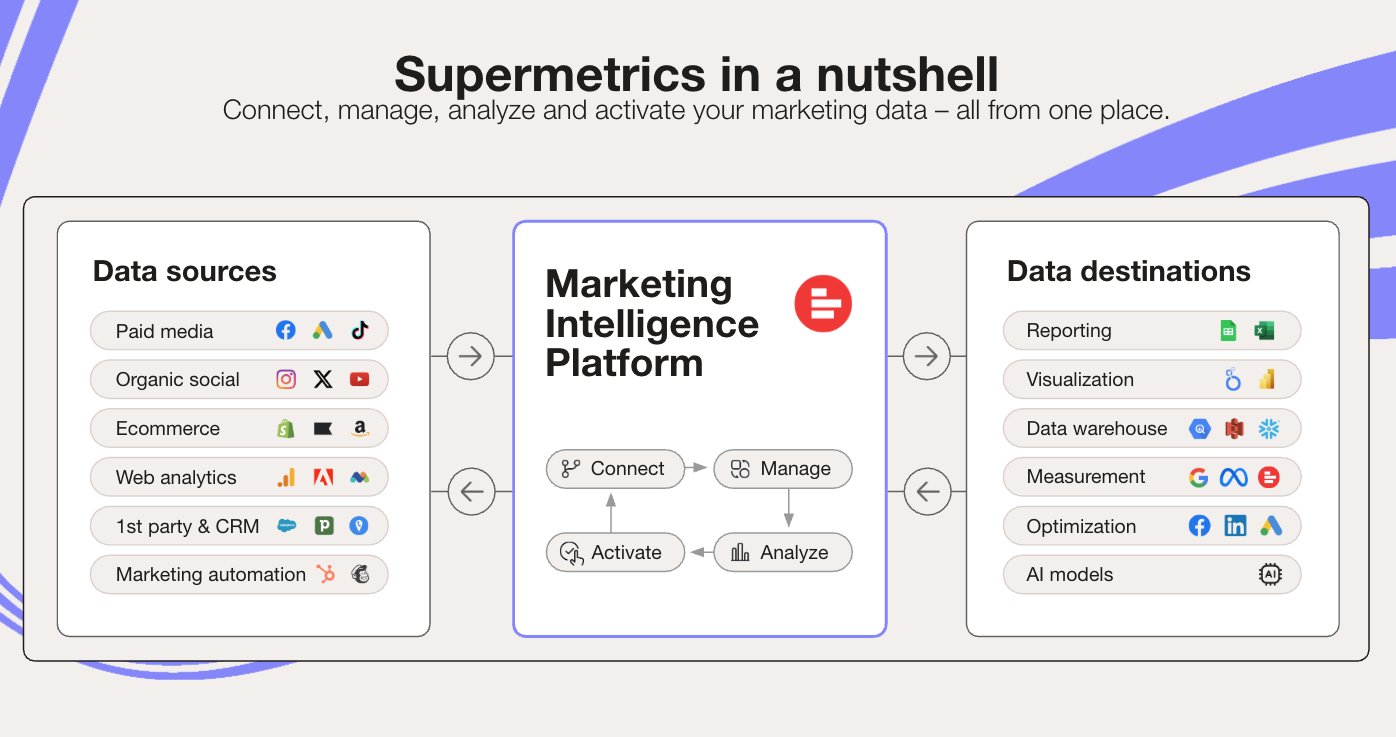
Supermetrics is the leading Marketing Intelligence Platform for agencies and brands that allows you to connect, manage, analyze, and activate your data.

Founded in 2010 by Mikael Thuneberg in Helsinki, Finland, Supermetrics started with a simple goal: to make marketing data more accessible and actionable for everyone. Today, the platform empowers over 200K organizations worldwide, including top brands like Nestlé, Warner Bros, and Dyson, by seamlessly connecting, managing, analyzing, and activating their data.

Supermetrics simplifies the complexities of data management by offering prebuilt and custom data pipelines that centralize data from more than 150 marketing and sales platforms. Whether it’s Google Analytics, Facebook Ads, HubSpot, or offline sources, Supermetrics brings all your marketing data together in one place—your preferred reporting, analytics, or storage tools.

With intuitive, no-code data management apps, Supermetrics helps users blend, enrich, and customize data for unique needs. From creating automated reports in Excel and Google Sheets to advanced visualizations in Power BI or Looker Studio, the platform enables teams to transform data into insights that drive impactful business decisions.

Trusted by organizations in 120+ countries, Supermetrics processes over 15% of global marketing data, delivering measurable improvements like increased marketing efficiency, higher conversion rates, and reduced costs. Its pioneering approach has earned recognition, including being named one of G2’s Top 50 Best EMEA Software Companies for 2024.

At its core, Supermetrics is committed to innovation, transparency, and customer success. As the marketing landscape evolves, Supermetrics continues to scale with its clients, ensuring they have the tools and data intelligence needed to grow.

For more information about their journey, products, and vision for the future, visit supermetrics.com

Key Benefits of Supermetrics:

  • Get data from anywhere, instantly with integrations for 150+ sources
  • Edit, manage, blend, enrich, and store your marketing data all in one place
  • Use the reporting tools you love to analyze, visualize and report on your data
  • Turn your marketing intelligence into action
Summary of Supermetrics platform and services

Why partner?

We’ve been working with Supermetrics and their customers for the last few years to build reporting and analytics solutions. Our consultancy is a natural partner for Supermetrics and helps to fill the technical gap that many companies have in working with their data. Our solutions have helped customers to understand and measure the value of their marketing programs and ultimately drive better decision-making and transparency.

Partnering with Supermetrics helps us to accomplish our mission to design and build analytics ecosystems that deliver the best outcomes for our customers.

“From the early days of implementation, Supermetrics brought in a partner, Calligo, who are very good. They’re very knowledgeable on the systems and the culture of working with Supermetrics and Calligo is great. Supermetrics’ willingness to listen and collaborate is invaluable. The product is great but the people and partnership is so important.”

Simon Barks
Director of Analytics
McCann Central

Why This Partnership Matters

The Modern Marketing Data Challenge

Today’s marketing teams face a common problem: fragmented data scattered across multiple platforms. This results in data silos, inconsistent reporting, and difficulties in uncovering meaningful insights. Without a streamlined data pipeline, marketing strategies risk being reactive rather than proactive or even entirely unsuccessful.

Key Outcomes:

Key outcomes of the Supermetrics x Calligo partnership

A Unified Solution: Supermetrics + Calligo

This partnership bridges the gap between data aggregation and actionable insights.

  • Supermetrics handles the heavy lifting of collecting and consolidating data from diverse sources.
  • Calligo builds the database structure and analysis tools to derive strategic insights from the aggregated data.

Together, we offer businesses a powerful combination: a seamless data flow that transforms raw data into a roadmap for smarter marketing strategies.

Supermetrics Meets Calligo’s Analytics Ecosystem

The Data Flow Explained

At a high level, here’s how the integration works:

  1. Data Collection: Supermetrics pulls marketing data from platforms like Google Ads, Facebook Ads, Bing, Meta, Google Analytics 4 and many more.
  2. Data Centralization: The aggregated data is seamlessly transferred to your analytics ecosystem or one hosted by Calligo.
  3. Data Transformation: Calligo’s data engineers process and prepare the data for analysis and interpretation.
  4. Actionable Insights: Reports give you immediate insights into how your marketing efforts are performing.
  5. Machine Learning: Machine learning models and analytics workflows generate insights that drive strategic decisions.
Supermetrics x Calligo Dataflow Diagram. From source to analytics.

This streamlined pipeline eliminates bottlenecks and ensures marketing teams have access to up-to-date, reliable insights. New insights generated by Machine Learning are automatically fed back into analytics ecosystem and surfaced in the reports.

Real-World Benefits for Businesses

Businesses leveraging this partnership can expect:

  • Multi-channel campaign analysis
  • Improved customer segmentation and targeting
  • Real-time performance dashboards
  • Predictive analytics for marketing ROI optimization

This integration isn’t just about improving workflows—it’s about driving measurable results.

Looking Ahead – Advanced Insights with Machine Learning

The future of marketing analytics lies in machine learning and predictive analytics. With Calligo’s expertise in machine learning workflows and Supermetrics’ data aggregation capabilities, businesses can unlock deeper insights:

  • Predict Campaign Performance: Anticipate campaign outcomes before launch.
  • Optimize Marketing Spend: Automatically identify high-performing channels.
  • Customer Behavior Insights: Gain granular insights into audience preferences and behaviors.
Requirements Gathering for Data Analytics Projects

Requirements Gathering for Analytics Projects

Introduction 

Behind every impactful dashboard you’ve ever seen is a well put together plan and an understanding of the objective in creating the tool. It does not matter if the dashboard is being used in a business context or to tell an interesting data story – any successful dashboard requires meticulous planning and an understanding of the underlying data paired with foundational data literacy skills. Regardless of what you’re building and who it is being built for, effective requirements gathering will generally lead to greater efficiency in development and greater user satisfaction. 

Requirements gathering is not a novel concept, but it’s not common either. Individuals and organizations often forgo the process under the misconception that they’re saving time. The reality is that not investing this time upfront leads to inefficiencies down the road, and those inefficiencies can be multitudes greater than the time it would have taken to effectively gather requirements prior to starting development. Multiple rounds of feedback, unsatisfied end users, and dashboards that receive little to no usage after going live are, unfortunately, staples of the analytics world today.  

The good news is that it doesn’t have to be this way. With an understanding of how to gather requirements plus the knowledge of why it is such a crucial step, you’ll be able to gain buy-in from stakeholders and deliver excellent, meaningful analytics products to end users.  

What is Requirements Gathering? 

When aiming to understand what requirements gathering is, it’s important to start by understanding what it is not. There are numerous strategies that attempt to mimic the process of gathering requirements, so let’s address a few of the most common: 

  • A single ticket submitted to an IT/analytics team – teams that service multiple parts of the organization often set up a ticketing system to elicit requirements and requests from end users. The problem is that teams often begin development immediately after receiving a ticket that often has limited information. The result is many hours or days that have been sunk into the development of a tool that is built on assumptions and has little chance of exciting users, or even meeting their needs, when it’s released. This is not an indictment of ticketing systems – in fact, ticketing systems are a great way to organize workstreams and manage a high volume of stakeholders, but it’s essential to move into a structured requirements gathering exercise as the first step after receiving a request. 
  • Technical requirements without business context – requirements gathering is meant to be a thorough, holistic approach to understanding what is being built and why. A common trap that developers fall into is believing that they only need to elicit the technical aspects of what they’re building. They see themselves as strictly technical resources, their stakeholders as strictly business-focused contributors, and they don’t bridge the gap between the two parties. A collaborative approach with buy-in from both sides to solve the business problem is key in requirements gathering. Empathy, curiosity, and an ability to step outside of the technical development world are essential skills to practice. 
  • Defining requirements for others – it should be stated that imagining what others need and developing products for them based on those gut feelings is not an effective way to work with end users. 

So, we know what does not constitute effective requirements gathering, but the real question is: how do we ensure that we go through this process and come out with the necessary information? Requirements gathering can be messy; it can and should result in jumbles of notes, ink smeared whiteboards, and a feeling of renewed energy for the design and development phase of the project. A lot of information will come up during these 1–2-hour sessions, but the following 4 focus areas will help structure your time: 

  • Determine the objective – drill into the “why” behind what is being built. It’s perfectly acceptable to start a requirements gathering session by asking the question, “why are we building this?” The idea is to drill into the business problem that we’re hoping to solve, and to understand how we plan to solve that. Ideally, we can create an objective statement that is measurable, then work backwards to understand how a specific tool or technology will accomplish that goal. 
  • Define the audience – aside from the overall objective, the most important consideration is the audience. Understanding who will use the tool, how and when they will use it, and their general ability to use analytics products are essential pieces of knowledge when considering design and deployment. The end goal is the ability to create specific user stories that can be used to guide the design and development of the tool in order to drive the greatest adoption. 
  • Outline priority questions – this is the time to dive into specific metrics and dimensions related to the data that will be utilized for the project. This information will be used to guide the design of individual visualizations and it is likely that you’ll map specific questions to specific visuals as you move into the design phase. Questions such as “How do each of my sales regions and the salespeople within them rank amongst one another by total volume sold?” represent the level of detail desired when drilling into priority questions. 
  • Document dashboard features/other details – lastly, we want to document any special functionality requests. Often times, users will be expecting certain features that they have seen from other tools, or that they have been imagining as valuable for the tool you are building. Think about filters, sorting, data exports, printer-friendly concepts for those paper lovers. These items can be make or break for users; spend time identifying those needs so you can plan to integrate them into the product. 

Final Thoughts 

Remember that requirements gathering is inherently social and requires a deep level of curiosity. It should be collaborative – stakeholders need to be involved and to feel that they’re involved. This isn’t just about soliciting requirements – it’s about gaining buy-in from end users and having them know that they played a crucial role in developing the end product. By defining the objective, audience, priority questions, and key functionality in collaboration with your stakeholders, you will be well equipped to move into the design phase of your project.  

Lastly, it is important to understand when requirements gathering has concluded. In an effort to provide clarity around when we have reached that point, formal documentation is passed to stakeholders and their sign-off is requested. By seeing the requirements formalized and delivered, you and your stakeholders will know that milestone has been completed, and that content will now be used to guide the design of the product. See below for a template that you can use next time you engage in requirements gathering.


REQUIREMENTS DOCUMENT TEMPLATE 

<Dashboard Name> 

<Date> 

PROBLEM STATEMENT 

<What are the client’s pain points? Why do they need this dashboard? Why have they come to us?> 

OBJECTIVE OF DASHBOARD 

<What is the business value of the dashboard? Does it help improve revenue? Does it highlight costs that can be reduced? Does it tell the story of an organization’s efforts? Does it increase employee retention?> 

AUDIENCE & USAGE 

<Description of section> 

  • Who will use the new dashboard 
  • Outline permissions 
  • When it will be used 
  • How often it will be updated 
  • Any subscriptions should be mentioned here 
  • Security features 
  • How it will be distributed & shared 

BUSINESS QUESTIONS & ACTIONS 

<Description of section> 

Question Action / Purpose 
Business Question 1 What will the answer to this question drive/result in? 
Ex. [Which customers have purchased one product, but not the other? What are these customers’ phone numbers?] Ex. [This allows our sales reps to telephone the customers who are most likely to purchase additional products] 


DASHBOARD SPECIFICS 

  • Date range of the data 
  • Filters 
  • Etc. 

QUESTIONS 

  • List any outstanding questions here 

Art + Data eBook - data visualization

Art + Data ebook

The importance of data visualization is simple; it helps people visualize, engage with, and better understand data. Powerful data storytelling can:

• Give your data an accurate context
• Make it readily intelligible, comprehensible and interrogable
• Free your data, putting it in the hands of the users who need it

Get these right and you turn data from being latent and underused into a genuine asset that can redefine your performance,
objectives and strategy. This is what this book aims to show.

These visualizations are examples of how raw data sources can be transformed into data stories. They show how even the most functional business operations, or the most complex, dense and changeable datasets can be presented attractively and usefully.

We hope that these 20 examples will inspire you to what could – and should – be possible with your data.


Unlocking Property Management Insights: Extracting and Analyzing Yardi Data

Unlocking Property Management Insights: Extracting and Analyzing Yardi Data


Join Nick Mishko, Senior Data Analytics Team Lead at Calligo, as he delves into the world of property management analytics and Yardi data.

Discover how Calligo’s data analytics practice transforms Yardi data into powerful tools, enhancing operational efficiency for property management firms globally. From data extraction challenges to creating dynamic dashboards, explore the strategies and solutions that propel businesses forward.

If you’re navigating Yardi complexities or seeking to leverage analytics for your property management endeavours, this insightful discussion is a must-watch. Stay tuned for more insights from Calligo Shorts!